
Most people in the diaspora know roughly what they send home each month. Very few have added up what it comes to over ten or twenty years, how much of it the transfer fees and exchange rate margins quietly take, or what it would look like if part of that money went into something that lasts.
This remittance savings calculator does all three. Enter what you send, how you send it and where it goes, then choose a share to redirect into a house, land, savings, a business or a farm. You see the total you will send, what is lost along the way, what your family receives, and what the redirected share could be worth at the end.
Remittance to Wealth Calculator
See what fees and FX take from years of sending money home, and what redirecting part of it could build.
Fetching live exchange rates...
If you keep sending the way you do now
Three ways to send the same money
| Scenario | Lost to fees, FX and cash-out | Family receives | Asset value at the end |
|---|
What the asset is made of (redirect and send cheaper)
Year by year
| After | Lost to costs (as now) | Asset (redirect) | Asset (redirect + cheaper) |
|---|
Your next step
The share link contains only this page's address, never your numbers.
How it works. Each month the calculator takes your amount, applies the transfer cost (percentage plus any flat fee, and the 1% US tax if ticked), then the cash-out fee on the family's portion. The redirected share is sent in the same way but goes into the asset, which grows at your net local return converted into your currency: (1 + local return) divided by (1 + the currency's yearly fall), minus 1. A 10% return with a 5% fall works out to about 4.8%. All figures are in future money, not adjusted for inflation. If the asset is where you live, no transfer cost applies to that share. These are planning estimates, not financial advice and not a forecast of any investment. Privacy: everything runs in your browser and nothing you enter is stored or sent. Your browser requests exchange rates from open.er-api.com, which can see your IP address but receives none of your figures.
How to Use the Remittance Savings Calculator
- Enter what you send. Choose your currency and destination, your average monthly amount and how many years to look ahead. Spread lump sums such as school fees across the year.
- Set what sending costs today. Pick the World Bank average that matches how you send, or enter your own provider’s flat fee and exchange rate margin. Add the cash-out fee your family pays to withdraw it.
- Choose a share to redirect. Set the percentage that goes into an asset instead of day-to-day support, what the asset is, its expected yearly return, and how much you expect the local currency to weaken each year.
- Compare three scenarios. Keep sending as now, redirect a share at today’s cost, or redirect a share and switch to a cheaper service.
The Fee You See Is Not the Whole Cost
Every transfer has up to three costs. The flat fee is the one providers advertise. The exchange rate margin is the gap between the rate you get and the mid-market rate, and it is usually larger. The cash-out fee is what your family pays a mobile money agent or bank to withdraw the money.
The World Bank puts the average cost of sending US$200 to Sub-Saharan Africa at 8.46% in the third quarter of 2025. Banks averaged 14.99%. Digital services averaged 4.59%. On the same money, the method you choose can more than triple the cost.
A Worked Example
Say you send US$500 a month to Ghana, rising 3% a year, at the Sub-Saharan Africa average of 8.46%.
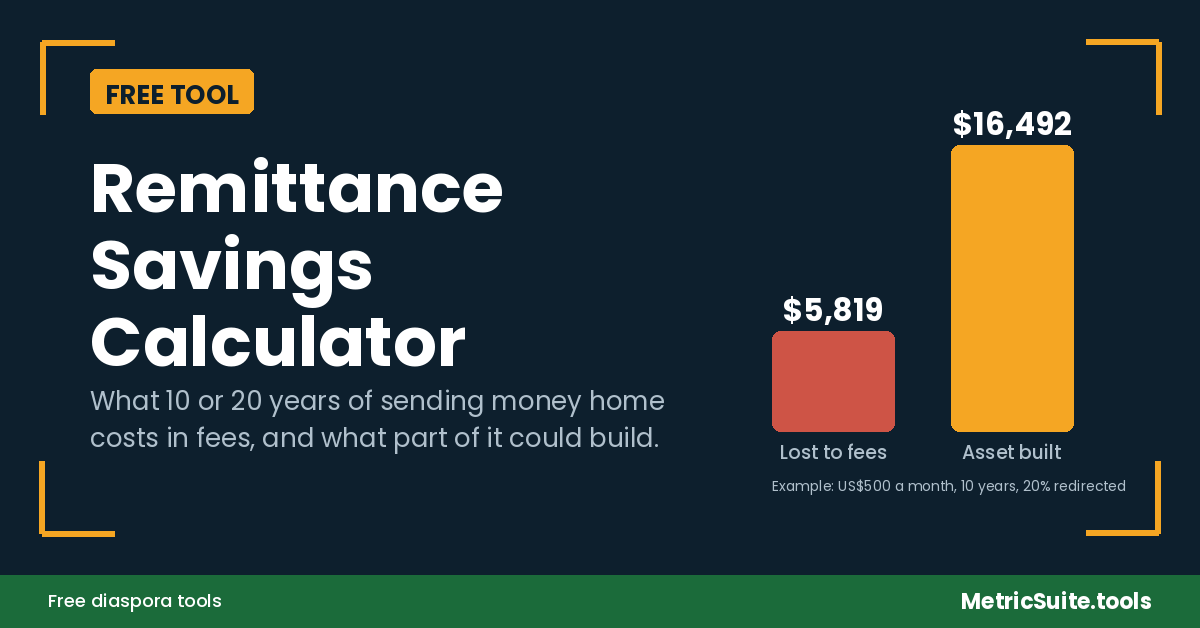
- Over 10 years you send about US$68,800. Fees and FX margins take about US$5,800, close to 12 months of what you send today.
- Switching to a digital service at 4.59% alone saves about US$2,700 over those 10 years, money your family receives instead.
- Redirecting 20% into a house build, with a 10% local return and the cedi falling 5% a year, and sending through a digital service, leaves an asset worth about US$16,500 after 10 years and about US$48,400 after 20.
Of that US$16,500, about US$13,100 is your own money and about US$3,400 is growth after the currency’s fall.
The trade-off is real. In the first month your family receives about US$382 instead of US$458. Agree that with them before you start.
These figures use the World Bank’s benchmarks for a US$200 transfer. Larger transfers usually cost a smaller share, so enter your own provider’s fee and margin for a sharper figure.
Why the Currency Matters More Than the Return
A 20% return in local currency sounds strong until the currency falls 15% in the same year. The calculator values the asset in the currency you send from, so it converts the local return into your currency. A 10% return with the currency falling 5% a year works out to about 4.8%, not 5%. In the example above, if the cedi fell 10% a year instead of 5%, the 10% local return would be worth nothing in dollar terms, and the house fund would hold only what you put in, about US$13,100.
Look at how the currency has moved over the last five years before you pick a number. A conservative figure here protects you more than an optimistic return.
Use a net return, too. Rent from a house is not the return once maintenance, empty months, property tax and agent fees come out, and a business return is what is left after running costs. All results are in future money, not adjusted for inflation.
Talk to Your Family First
Redirecting part of what you send is a family decision, not only a financial one. People who make it work usually agree a fixed support figure in advance, explain what the rest is building, and share progress, such as photos of the build or statements from the account. The Black Tax Calculator helps you set that support figure against your income, and the guide to family financial support covers how people structure it.
Where to Go Next
- Building a house? Check your contractor’s quote with the Ghana House Build Cost Calculator and read How to Build a House in Ghana From Abroad. The Build From Abroad Control Workbook tracks every payment to your builder.
- Cutting the leak? Compare providers with the Africa Remittance Comparison or the Caribbean Remittance Comparator, and check withdrawal charges with the mobile money fee tools.
- Earning from overseas clients? The Get Paid From Abroad Calculator compares Payoneer, Wise, PayPal and bank wire on what you keep.
- Weighing where to invest? Read Diaspora Investing in Africa and the Caribbean.
Every diaspora tool is on the Diaspora Tools hub.
These are planning estimates, not financial advice and not a forecast of any investment. Fees, rates and returns change. Confirm costs with your provider and get qualified advice before committing money.
Sources
- World Bank, Remittance Prices Worldwide, Issue 54 (Q3 2025): https://remittanceprices.worldbank.org/sites/default/files/2026-04/RPW_main_report_and_annex_Q325.pdf
- World Bank, Remittance Prices Worldwide (database): https://remittanceprices.worldbank.org/
- IRS, Treasury and IRS issue proposed regulations on the new remittance transfer tax: https://www.irs.gov/newsroom/treasury-irs-issue-proposed-regulations-on-the-new-remittance-transfer-tax-established-under-the-one-big-beautiful-bill
- Exchange rates: open.er-api.com (live, with fallback rates)
FAQ
What does the remittance savings calculator show?
It shows what you will send home over 5 to 25 years, how much transfer fees, exchange rate margins and cash-out fees take, what your family receives, and what redirecting a share into an asset could be worth at the end.
Where do the transfer cost figures come from?
The presets are World Bank Remittance Prices Worldwide averages for sending US$200 in Q3 2025: 14.99% for banks, 8.46% to Sub-Saharan Africa, 6.36% across all services, 4.59% for digital services and 3.54% for digital-only operators. These are benchmarks for a US$200 transfer, and larger transfers usually cost a smaller share, so enter your own provider’s flat fee and margin for your real cost. The results show the transfer cost the calculator used
Why does the calculator adjust the return for currency depreciation?
Because an asset at home earns in the local currency, but you measure your wealth in the currency you earn. The calculator uses (1 + local return) divided by (1 + the currency’s yearly fall), minus 1. If the local currency falls 8% a year, an 8% local return leaves you where you started in your own currency.
Does the 1% US remittance tax apply to me?
Only if you send from the US and fund the transfer with cash, a money order or a cashier’s check. Transfers funded from a US bank account, debit card or credit card are exempt. Tick the box in the calculator to include it.
Will my family receive less if I redirect part of what I send?
Yes, in the short term. The calculator shows the first-month difference so you can agree the trade-off with your family. Switching to a cheaper transfer service recovers part of it.
Is my information stored?
No. The calculator runs in your browser and nothing you enter is stored or sent. Your browser requests exchange rates from open.er-api.com, which receives none of your figures.
Sources
- World Bank, Remittance Prices Worldwide, Issue 54 (Q3 2025): https://remittanceprices.worldbank.org/sites/default/files/2026-04/RPW_main_report_and_annex_Q325.pdf
- World Bank, Remittance Prices Worldwide (database): https://remittanceprices.worldbank.org/
- IRS, Treasury and IRS issue proposed regulations on the new remittance transfer tax: https://www.irs.gov/newsroom/treasury-irs-issue-proposed-regulations-on-the-new-remittance-transfer-tax-established-under-the-one-big-beautiful-bill
- Exchange rates: open.er-api.com (live, with fallback rates)